Illustrating biodiversity monitoring for Nature Metrics
PARTNER
Nature Metrics is a global nature intelligence provider specialising in environmental DNA (eDNA) technologies to monitor biodiversity and help businesses integrate nature data into their decision-making.
PROJECT OVERVIEW
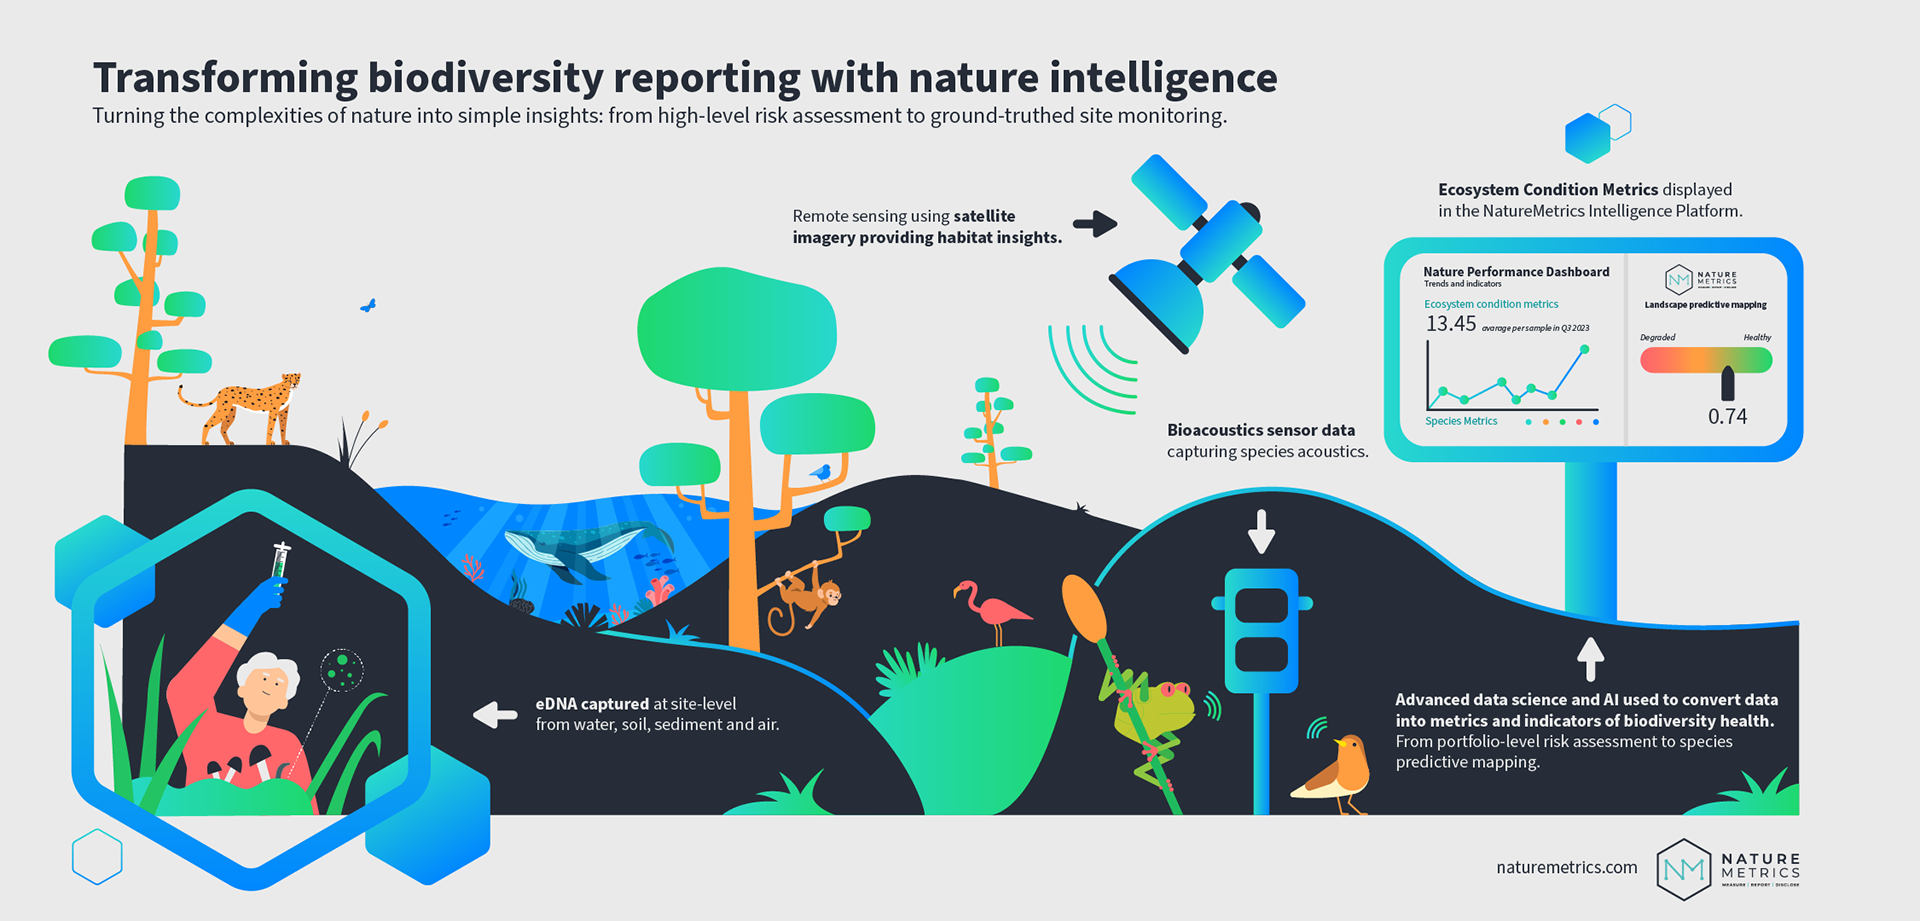
Over the past year, we have collaborated with Nature Metrics on a series of infographics designed to communicate complex scientific concepts with clarity and visual impact.
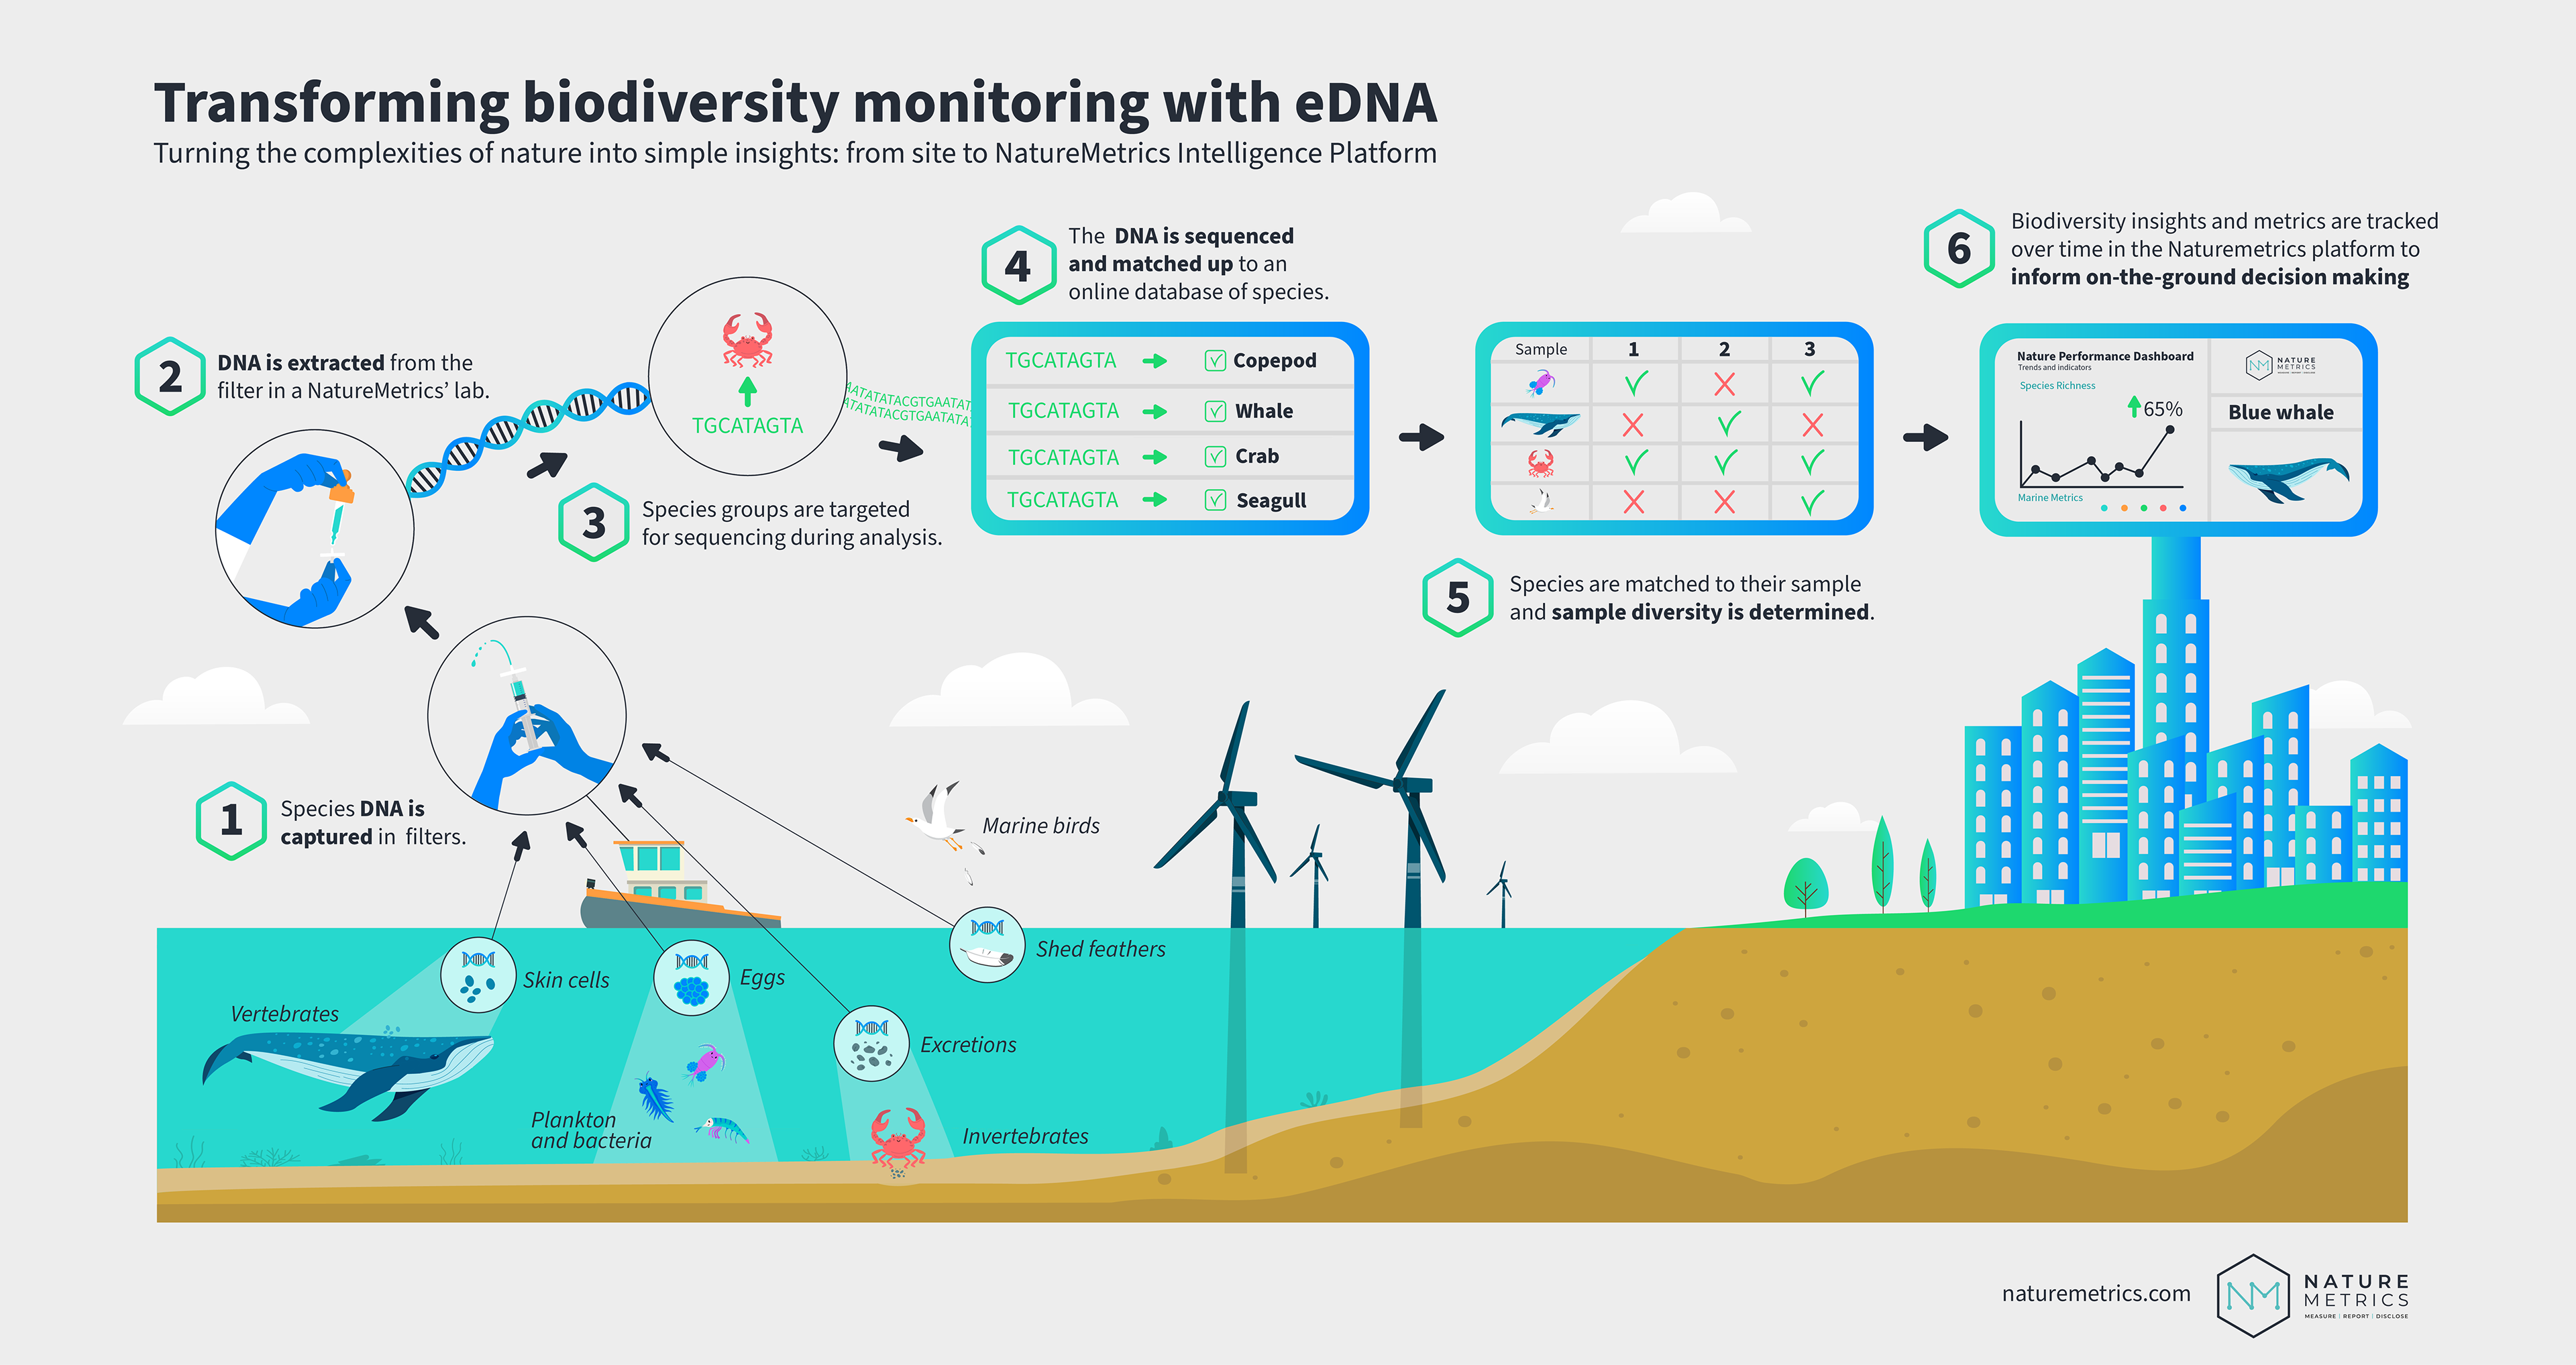
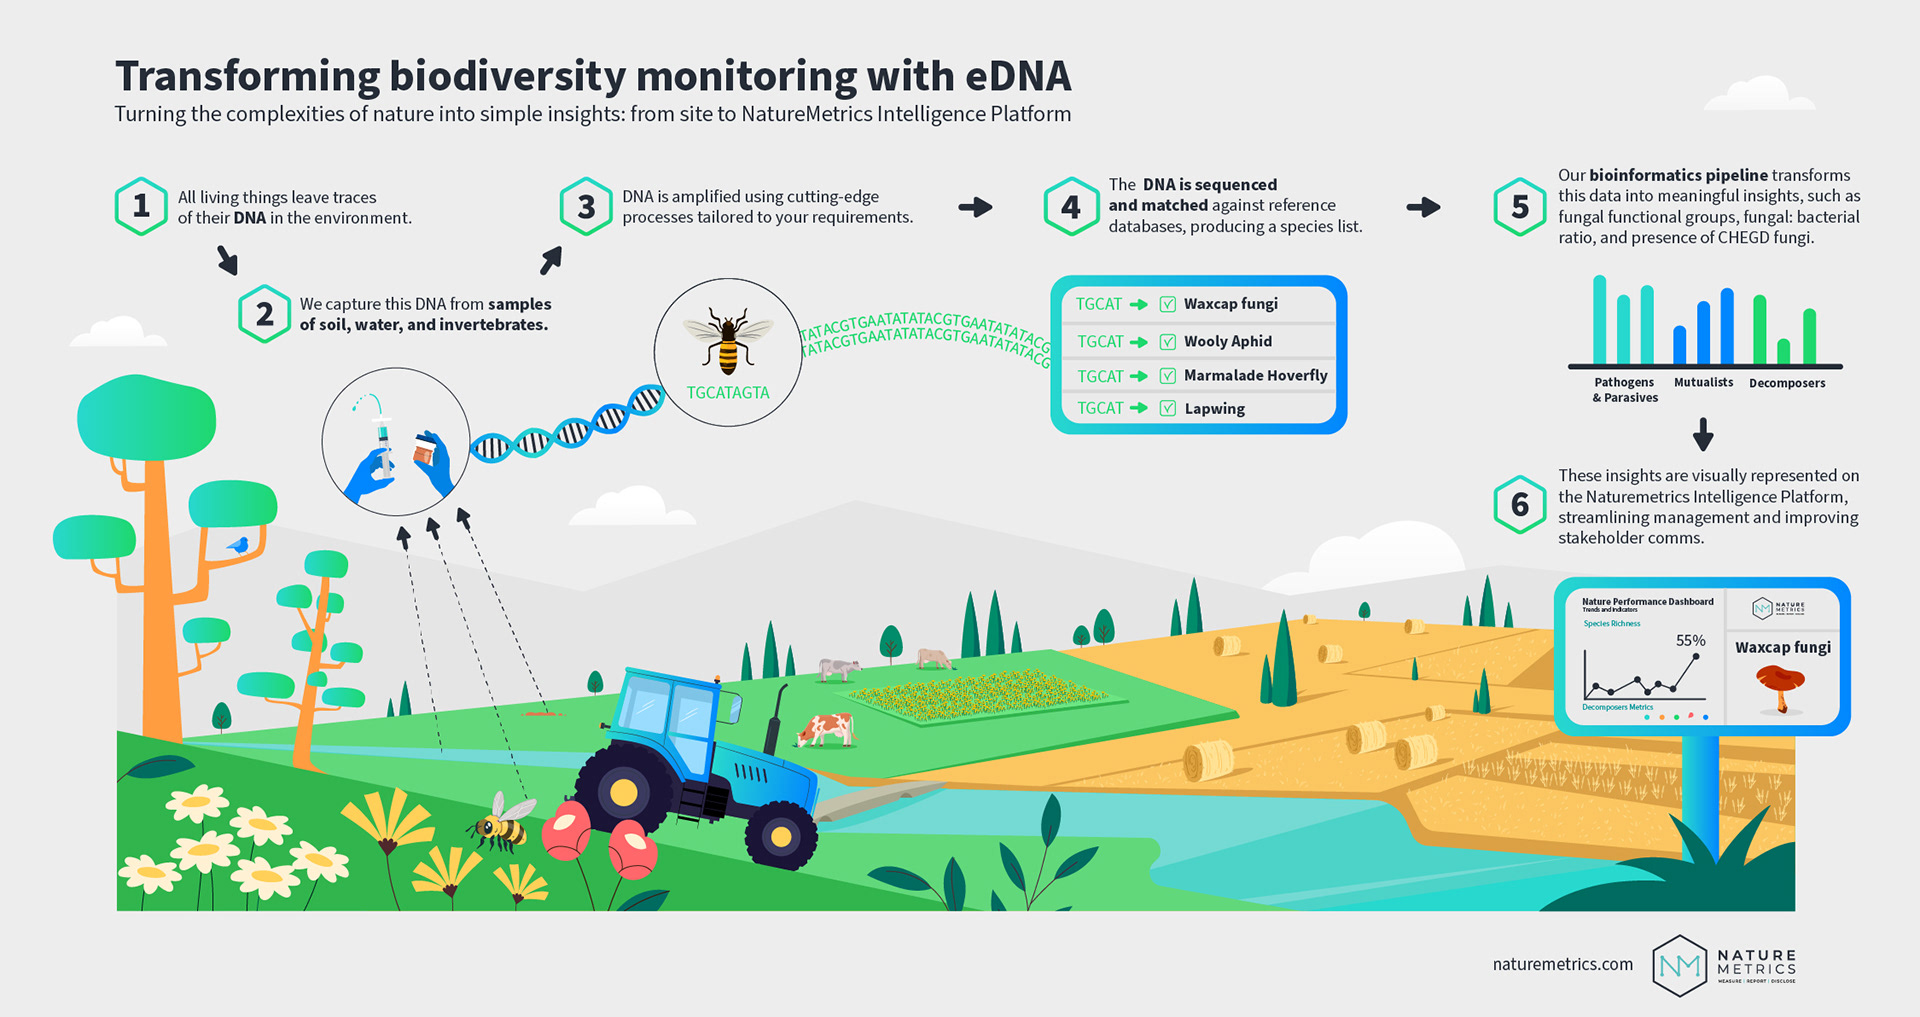
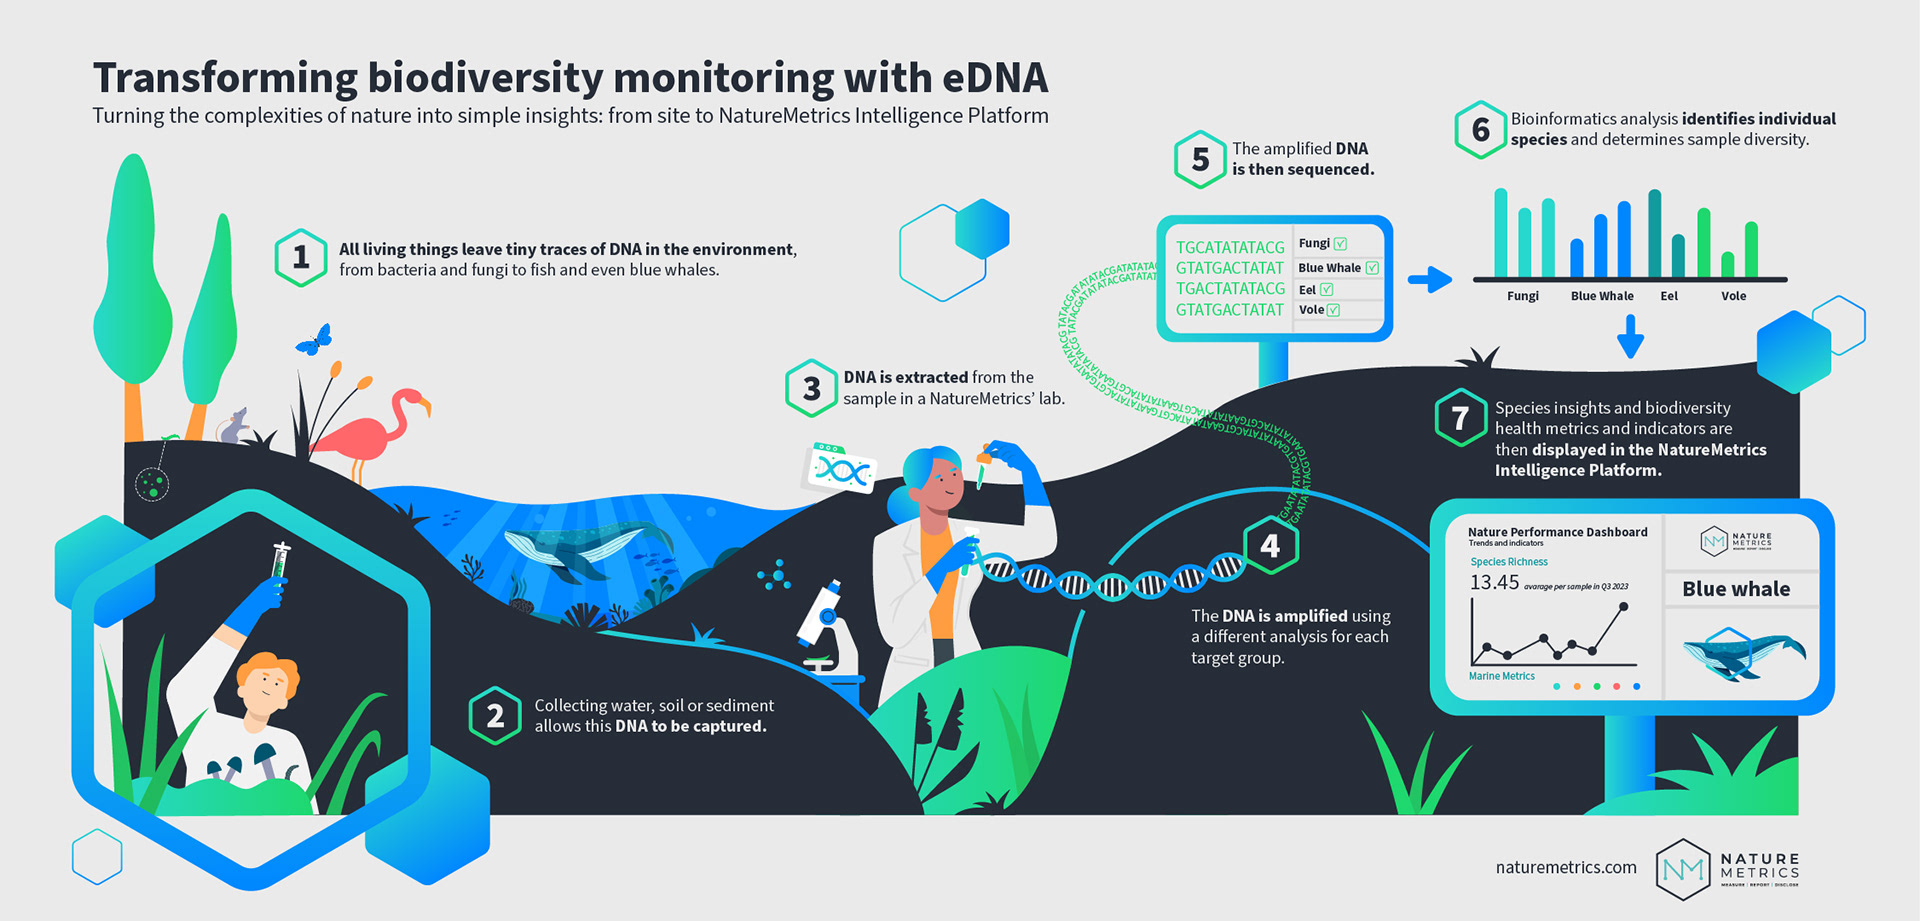
The themes -"Transforming Biodiversity Reporting with Nature Intelligence" and "Transforming Biodiversity Monitoring with eDNA" - were central to Nature Metrics’ mission to make biodiversity measurable at scale to underpin global goals and accelerate finance into nature.
The themes -"Transforming Biodiversity Reporting with Nature Intelligence" and "Transforming Biodiversity Monitoring with eDNA" - were central to Nature Metrics’ mission to make biodiversity measurable at scale to underpin global goals and accelerate finance into nature.
OBJECTIVES
🔹Translate technical and scientific concepts into accessible visual explanations.
🔹Create both animated and static infographics for use across digital channels, presentations, websites
and stakeholder engagement.
🔹Maintain a cohesive visual identity aligned with Nature Metrics’ brand.
🔹Maintain a cohesive visual identity aligned with Nature Metrics’ brand.
🔹Support the client’s storytelling around innovation in biodiversity monitoring.
OUR ROLE
🔹Concept development in collaboration with the Nature Metrics communication team.
🔹Visual storytelling and design.
🔹Animation (where applicable).
🔹Delivery of assets optimised for web, social, and print use.
OUR APPROACH
We developed a visual language inspired by nature’s branding aesthetic.
Each infographic was structured to take viewers on a journey, from beginning to end, using data-driven illustrations, clean typography and a consistent color palette.
The animated versions rely on subtle motion to enhance understanding without overwhelming the content.
Each infographic was structured to take viewers on a journey, from beginning to end, using data-driven illustrations, clean typography and a consistent color palette.
The animated versions rely on subtle motion to enhance understanding without overwhelming the content.
Some of the key creative decisions included:
🔹Illustrate different ecosystems to explain the process across different environments.
🔹Designing intuitive timelines to explain eDNA workflows
OUTCOME
The infographics became an integral part of Nature Metrics’ communication toolkit.
They were featured in presentations and biodiversity projects, helping the company clearly convey its innovative methods and insights to both technical and non-technical audiences.
They were featured in presentations and biodiversity projects, helping the company clearly convey its innovative methods and insights to both technical and non-technical audiences.
KIND WORDS
“ I use this graphic all the time with our biodiversity projects, thank you for your brilliant vision in bringing this concept to life 👏 having clear and varied communication assets is vital for making progress on nature! 🙏”
Dr. Molly Clavey - NatureMetrics knowledge exchange & biodiversity expert
Dr. Molly Clavey - NatureMetrics knowledge exchange & biodiversity expert